
Section 3.4 Measures of Relative Position

Measures of relative position compare the position of one value in relation to other values in the data set.

Definition 3.4.1.

If \(n\%\) of the items in a distribution are less than a particular data item, we say that the data item is in the \(n\)th percentile of the distribution.
In Excel: PERCENTILE.EXC

Definition 3.4.2.

The percentile rank identifies the percentile of a particular value within a data set.
In Excel: PERCENTRANK.EXC

Exercise 3.4.3.

A new baby is in the \(30\)th percentile for weight. What does that mean?
Answer.
\(30\%\) of babies (at that age) weigh less than this baby.

Definition 3.4.4.

Quartiles are commonly encountered percentiles. Quartiles divide data sets into four equal parts.
Figure 3.4.5. Quartiles Example powered by Desmos
The first, second, and third quartiles in a data set are the values for the \(25\)th, \(50\)th, and \(75\)th percentiles, respectively. They are denoted by \(Q_1\text{,}\) \(Q_2\text{,}\) and \(Q_3\text{.}\)
\begin{equation*} \text{In Excel: QUARTILE.EXC} \end{equation*}

Definition 3.4.6.

The interquartile range (IQR) describes the range of the middle \(50\%\) of a data set.
\begin{equation*} \text{Formula: } IQR = Q_3-Q_1 \end{equation*}

Exercise 3.4.7.

(Donnelly, Your Turn 8)
The data in the Excel file below lists the U.S. and Canadian box-office revenues for the highest grossing films of all time (in millions of dollars). Use Excel formulas to calculate the following:

(a)

The three quartiles and the IQR
Answer.
  • \(\displaystyle Q_1:\;\; =QUARTILE.EXC(B2:B23,1)\approx 840.149\text{ millions of dollars} \)
  • \(\displaystyle Q_2:\;\; =QUARTILE.EXC(B2:B23,2)\approx 954.869 \text{ millions of dollars} \)
  • \(\displaystyle Q_3:\;\; =QUARTILE.EXC(B2:B23,3)\approx 1213.022 \text{ millions of dollars} \)
  • \(\displaystyle IQR=Q_3-Q1\approx 372.873\text{ millions of dollars}\)

(b)

The \(65\)th percentile
Answer.
\(=PERCENTILE.EXC(B2:B23,0.65)\approx 1133.350\text{ millions of dollars}\)

(c)

The percentile rank for the film Avatar.
Answer.
\(=PERCENTRANK.EXC(B2:B23,B16) = 0.347=34.7\%\)

Definition 3.4.8.

  • The list consisting of the minimum, \(Q_1\text{,}\) \(Q_2\text{,}\) \(Q_3\text{,}\) and maximum values of a data set is called the 5-number summary.
  • The graphical display for this list is called the box-and-whisker plot and also includes any outliers.

Exercise 3.4.9.

(Donnelly 3.76)
The data in the Excel file below indicates the battery life, in minutes, on a single charge, for 25 iPads.

(a)

Construct a box-and-whisker plot for the data.
Answer.

(b)

Compute the 5-number summary for the data.
Answer.
  • Minimum: \(=MIN(A2:A26)=215\)
  • \(Q_1\text{:}\) \(=QUARTILE.EXC(A2:A26,1)= 239.5 \)
  • \(Q_2\text{:}\) \(=QUARTILE.EXC(A2:A26,2)= 271 \)
  • \(Q_3\text{:}\) \(=QUARTILE.EXC(A2:A26,3)= 293 \)
  • Maximum: \(=MAX(A2:A26)=330\)

Note 3.4.10.

Outliers are any data points less than \(Q_1-(1.5)\cdot (IQR)\) or greater than \(Q_3+(1.5)\cdot (IQR)\text{.}\)
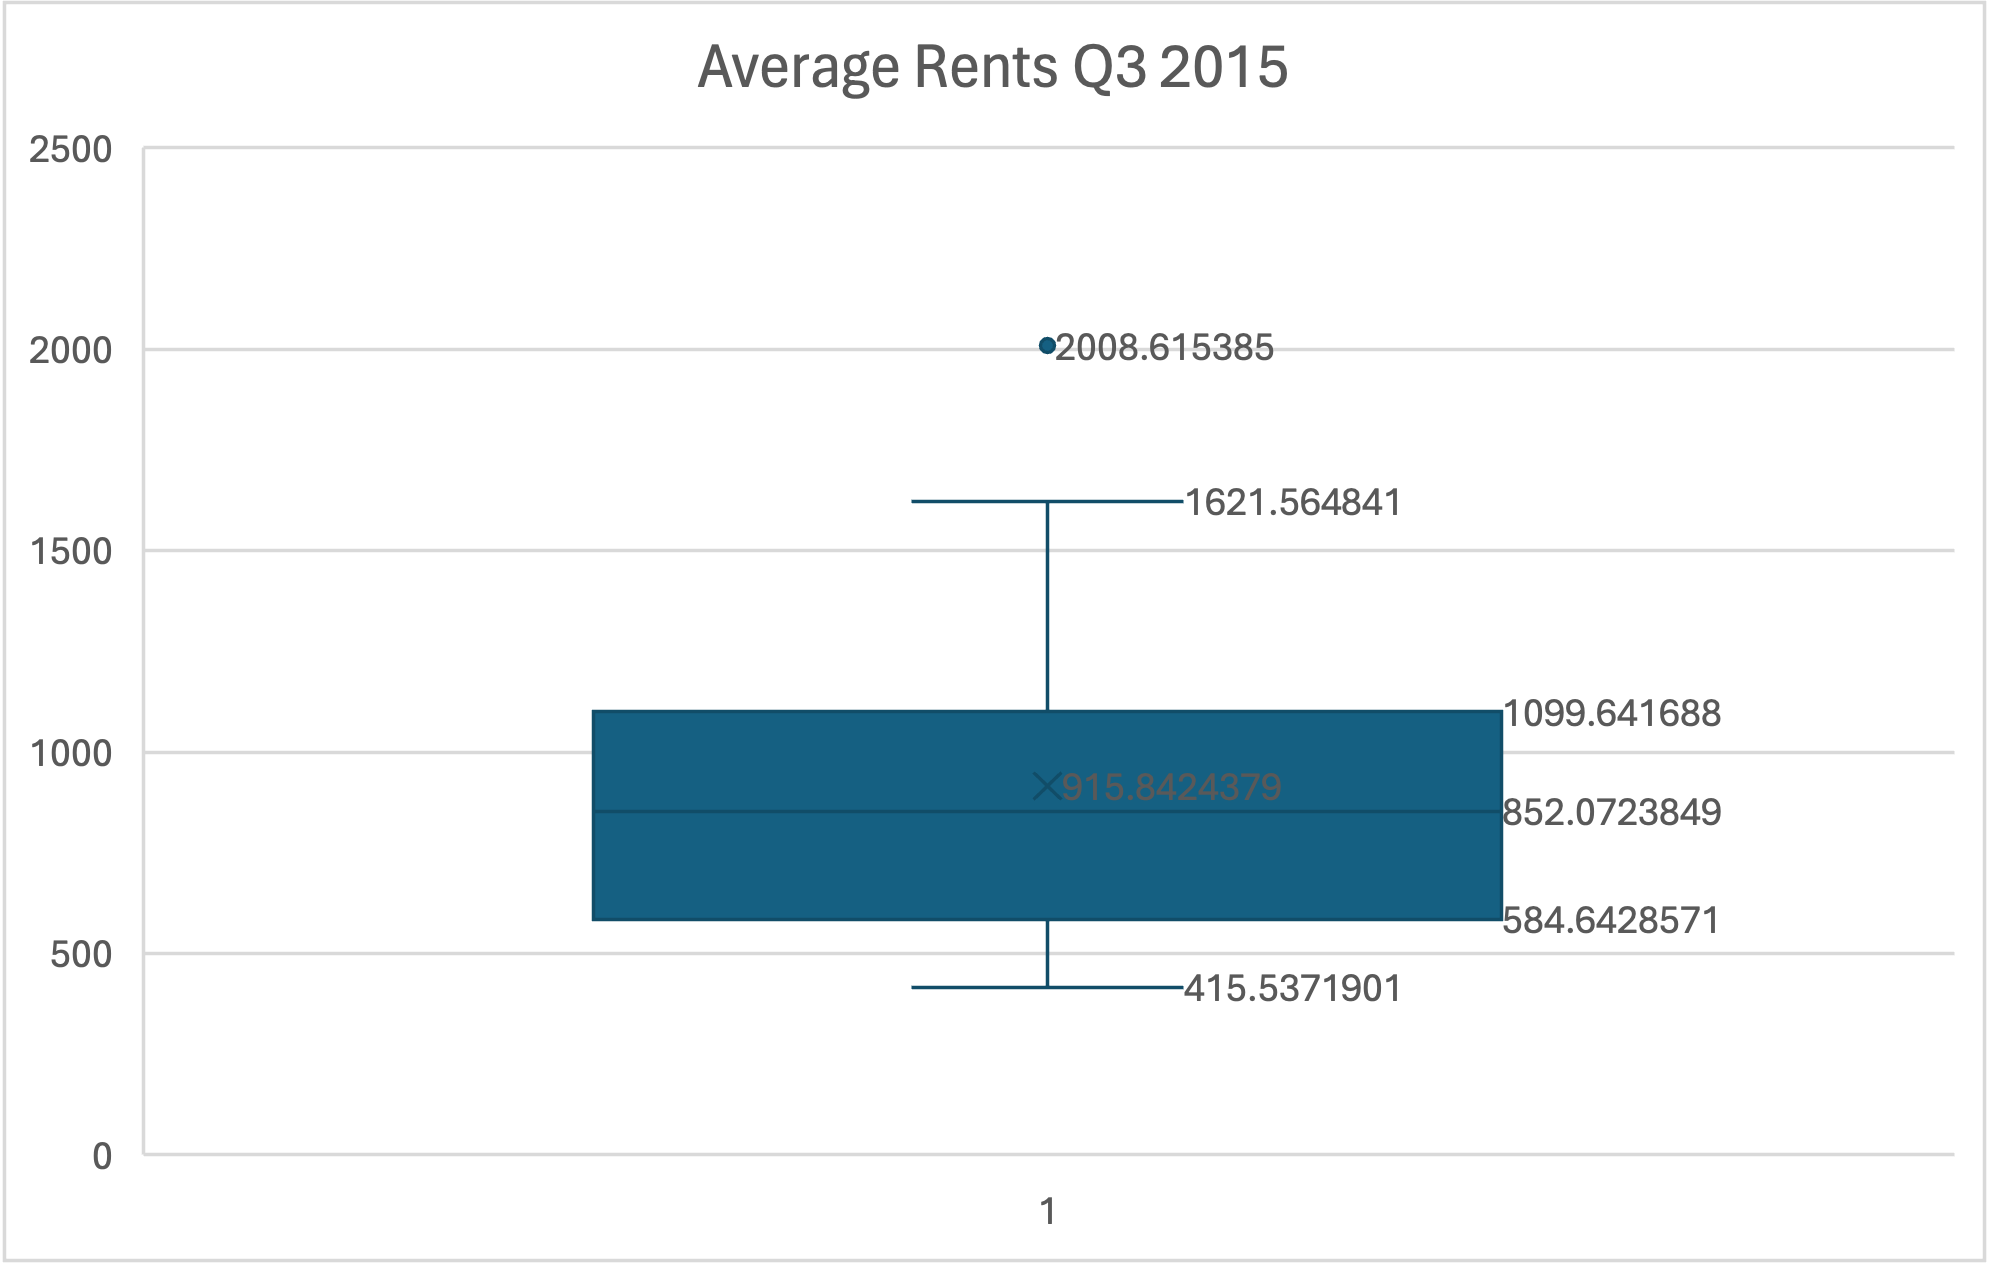
Exercise 3.4.11.

The Excel file below includes average rent prices in a number of places in Colorado in quarter 3 of 2015. Create a box-and-whisker plot for the average rent prices and identify any outliers.
Answer.
The only outlier is the value \(\$ 2008.62\text{,}\) which is the average rent for Boulder/Broomfield.