Section 5.2 Descriptive Statistics for a Discrete Probability Distribution

There are a lot of things we might want to ask when we’re working with a discrete probability distribution. For example, what average value would we expect rolling a die or playing a gambling game? How spread out are the values? These are all questions we want to be able to answer.

Investigation 5.2.1.

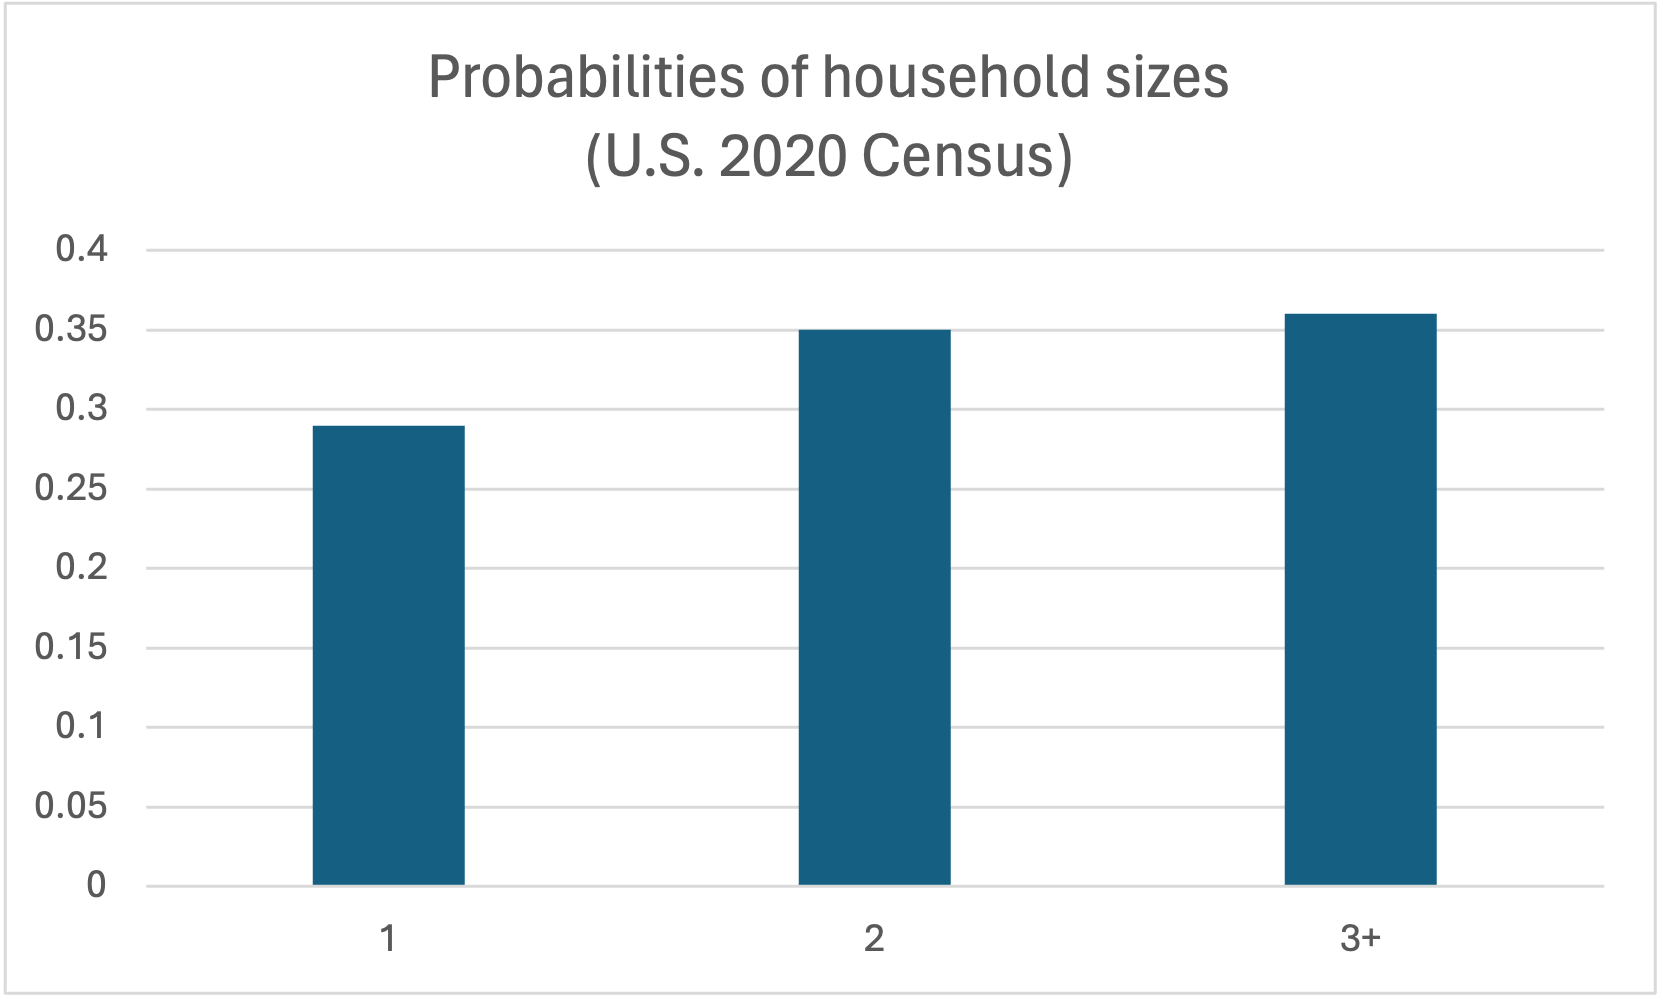
The 2020 United States Census found the number of households of different sizes. (Source: Table H2 from https://www.census.gov/data/tables/2023/demo/families/cps-2023.html)
Below are the probabilities for different values of household size.
Size 1 member 2 members 3 or more members
Probability 0.290 0.350 0.360
What was the average household size in the United States in 2020?

Definition 5.2.1.

  • The mean, or expected value of a discrete probability distribution is the weighted average of all outcomes of the random variable.
    \begin{equation*} E(X)=\mu=\sum_{i=1}^n x_iP(x_i) \end{equation*}
  • The expected monetary value is the mean when the discrete random variable is in dollars ($)
  • The variance of a discrete probability distribution measures the spread of the individual values around the mean.
    \begin{equation*} \sigma^2=\sum_{i=1}^n (x_i-\mu)^2P(x_i) \end{equation*}
  • The standard deviation of a discrete probability distribution measures the dispersion of the outcome of the random variable in relation to the mean.
    \begin{equation*} \sigma=\sqrt{\sigma^2} \end{equation*}

Example 5.2.2.

(Donnely 5.7) The table below shows the discrete probability distribution for the number of bedrooms per house in a certain community:
\(\#\) of Bedrooms Probability
3 0.23
4 0.57
5 0.14
6 ???

(a)

Determine the missing probability for a 6-bedroom house.

Answer.

\begin{equation*} 1-(0.23+0.57+0.14)=0.06 \end{equation*}

(b)

Determine the mean number of bedrooms per house.

Answer.

\begin{equation*} \mu=\text{expected number of bedrooms}=3\cdot (0.23)+4\cdot (0.57)+5\cdot (0.14)+6\cdot (0.06)=4.03 \end{equation*}

(c)

Determine the standard deviation for the number of bedrooms per house. (Hint: Use a table like the one below in Excel to compute the variance first. Do all the calculations in Excel.)
Here is a link to an Excel file with a blank table like the one below: external/sheets/BedroomsCalculation.xlsx
Table 5.2.3. Calculation of Standard Deviation
\(x\) \(P(x)\) \(\mu\) \(x-\mu\) \((x-\mu)^2\) \((x-\mu)^2P(x)\)
3
4
5
6

Answer.

Standard deviation: \(\approx 0.7804\)
Here is an Excel file where you can see the work for this problem: external/sheets/BedroomsCalculationSolution.xlsx

Example 5.2.4.

(Donnelly 5.45)
Tees R Us manufactures and sells T-shirts for sporting events, is providing shirts for an upcoming tournament. Each shirt will cost \(\$9\) to produce and will be sold for \(\$18\text{.}\) Any unsold shirts at the end of the tournament can be sold for \(\$5\) a piece in the near future. Tees R Us assumes the demand for the shirts will be \(500\text{,}\) \(1000\text{,}\) \(1500\text{,}\) or \(2000\text{.}\) They also estimate that the probabilities of each of these sales levels occurring will be \(15\%\text{,}\) \(20\%\text{,}\) \(25\%\text{,}\) and \(40\%\text{,}\) respectively. Determine the expected monetary value of the project if Tees R Us chooses to print \(1500\) shirts for the tournament.
Here is an Excel file you can use for this problem: external/sheets/TeesRUs.xlsx