Skip to main content
Contents Embed Dark Mode Prev Up Next \(\newcommand{\N}{\mathbb N} \newcommand{\Z}{\mathbb Z} \newcommand{\Q}{\mathbb Q} \newcommand{\R}{\mathbb R}
\newcommand{\lt}{<}
\newcommand{\gt}{>}
\newcommand{\amp}{&}
\definecolor{fillinmathshade}{gray}{0.9}
\newcommand{\fillinmath}[1]{\mathchoice{\colorbox{fillinmathshade}{$\displaystyle \phantom{\,#1\,}$}}{\colorbox{fillinmathshade}{$\textstyle \phantom{\,#1\,}$}}{\colorbox{fillinmathshade}{$\scriptstyle \phantom{\,#1\,}$}}{\colorbox{fillinmathshade}{$\scriptscriptstyle\phantom{\,#1\,}$}}}
\)
Section 3.4 Measures of Relative Position
Measures of relative position compare the position of one value in relation to other values in the data set.
Definition 3.4.1 .
If
\(n\%\) of the items in a distribution are less than a particular data item, we say that the data item is in the
\(n\) th percentile of the distribution.
Definition 3.4.2 .
The
percentile rank identifies the percentile of a particular value within a data set.
In Excel: PERCENTRANK.EXC
Exercise 3.4.3 .
A new baby is in the
\(30\) th percentile for weight. What does that mean?
Answer .
\(30\%\) of babies (at that age) weigh less than this baby.
Definition 3.4.4 .
Quartiles are commonly encountered percentiles. Quartiles divide data sets into four equal parts.
Figure 3.4.5. Quartiles Example powered by DesmosThe first, second, and third quartiles in a data set are the values for the
\(25\) th,
\(50\) th, and
\(75\) th percentiles, respectively. They are denoted by
\(Q_1\text{,}\) \(Q_2\text{,}\) and
\(Q_3\text{.}\)
\begin{equation*}
\text{In Excel: QUARTILE.EXC}
\end{equation*}
Definition 3.4.6 .
The interquartile range (IQR) describes the range of the middle \(50\%\) of a data set.
\begin{equation*}
\text{Formula: } IQR = Q_3-Q_1
\end{equation*}
Exercise 3.4.7 .
The data in the Excel file below lists the U.S. and Canadian box-office revenues for the highest grossing films of all time (in millions of dollars). Use Excel formulas to calculate the following:
(a) The three quartiles and the IQR
Answer .
\(\displaystyle Q_1:\;\; =QUARTILE.EXC(B2:B23,1)\approx 840.149\text{ millions of dollars} \)
\(\displaystyle Q_2:\;\; =QUARTILE.EXC(B2:B23,2)\approx 954.869 \text{ millions of dollars} \)
\(\displaystyle Q_3:\;\; =QUARTILE.EXC(B2:B23,3)\approx 1213.022 \text{ millions of dollars} \)
\(\displaystyle IQR=Q_3-Q1\approx 372.873\text{ millions of dollars}\)
(b) Answer .
\(=PERCENTILE.EXC(B2:B23,0.65)\approx 1133.350\text{ millions of dollars}\)
(c) The percentile rank for the film
Avatar .
Answer .
\(=PERCENTRANK.EXC(B2:B23,B16) = 0.347=34.7\%\)
Definition 3.4.8 .
The list consisting of the minimum,
\(Q_1\text{,}\) \(Q_2\text{,}\) \(Q_3\text{,}\) and maximum values of a data set is called the
5-number summary .
The graphical display for this list is called the
box-and-whisker plot and also includes any outliers.
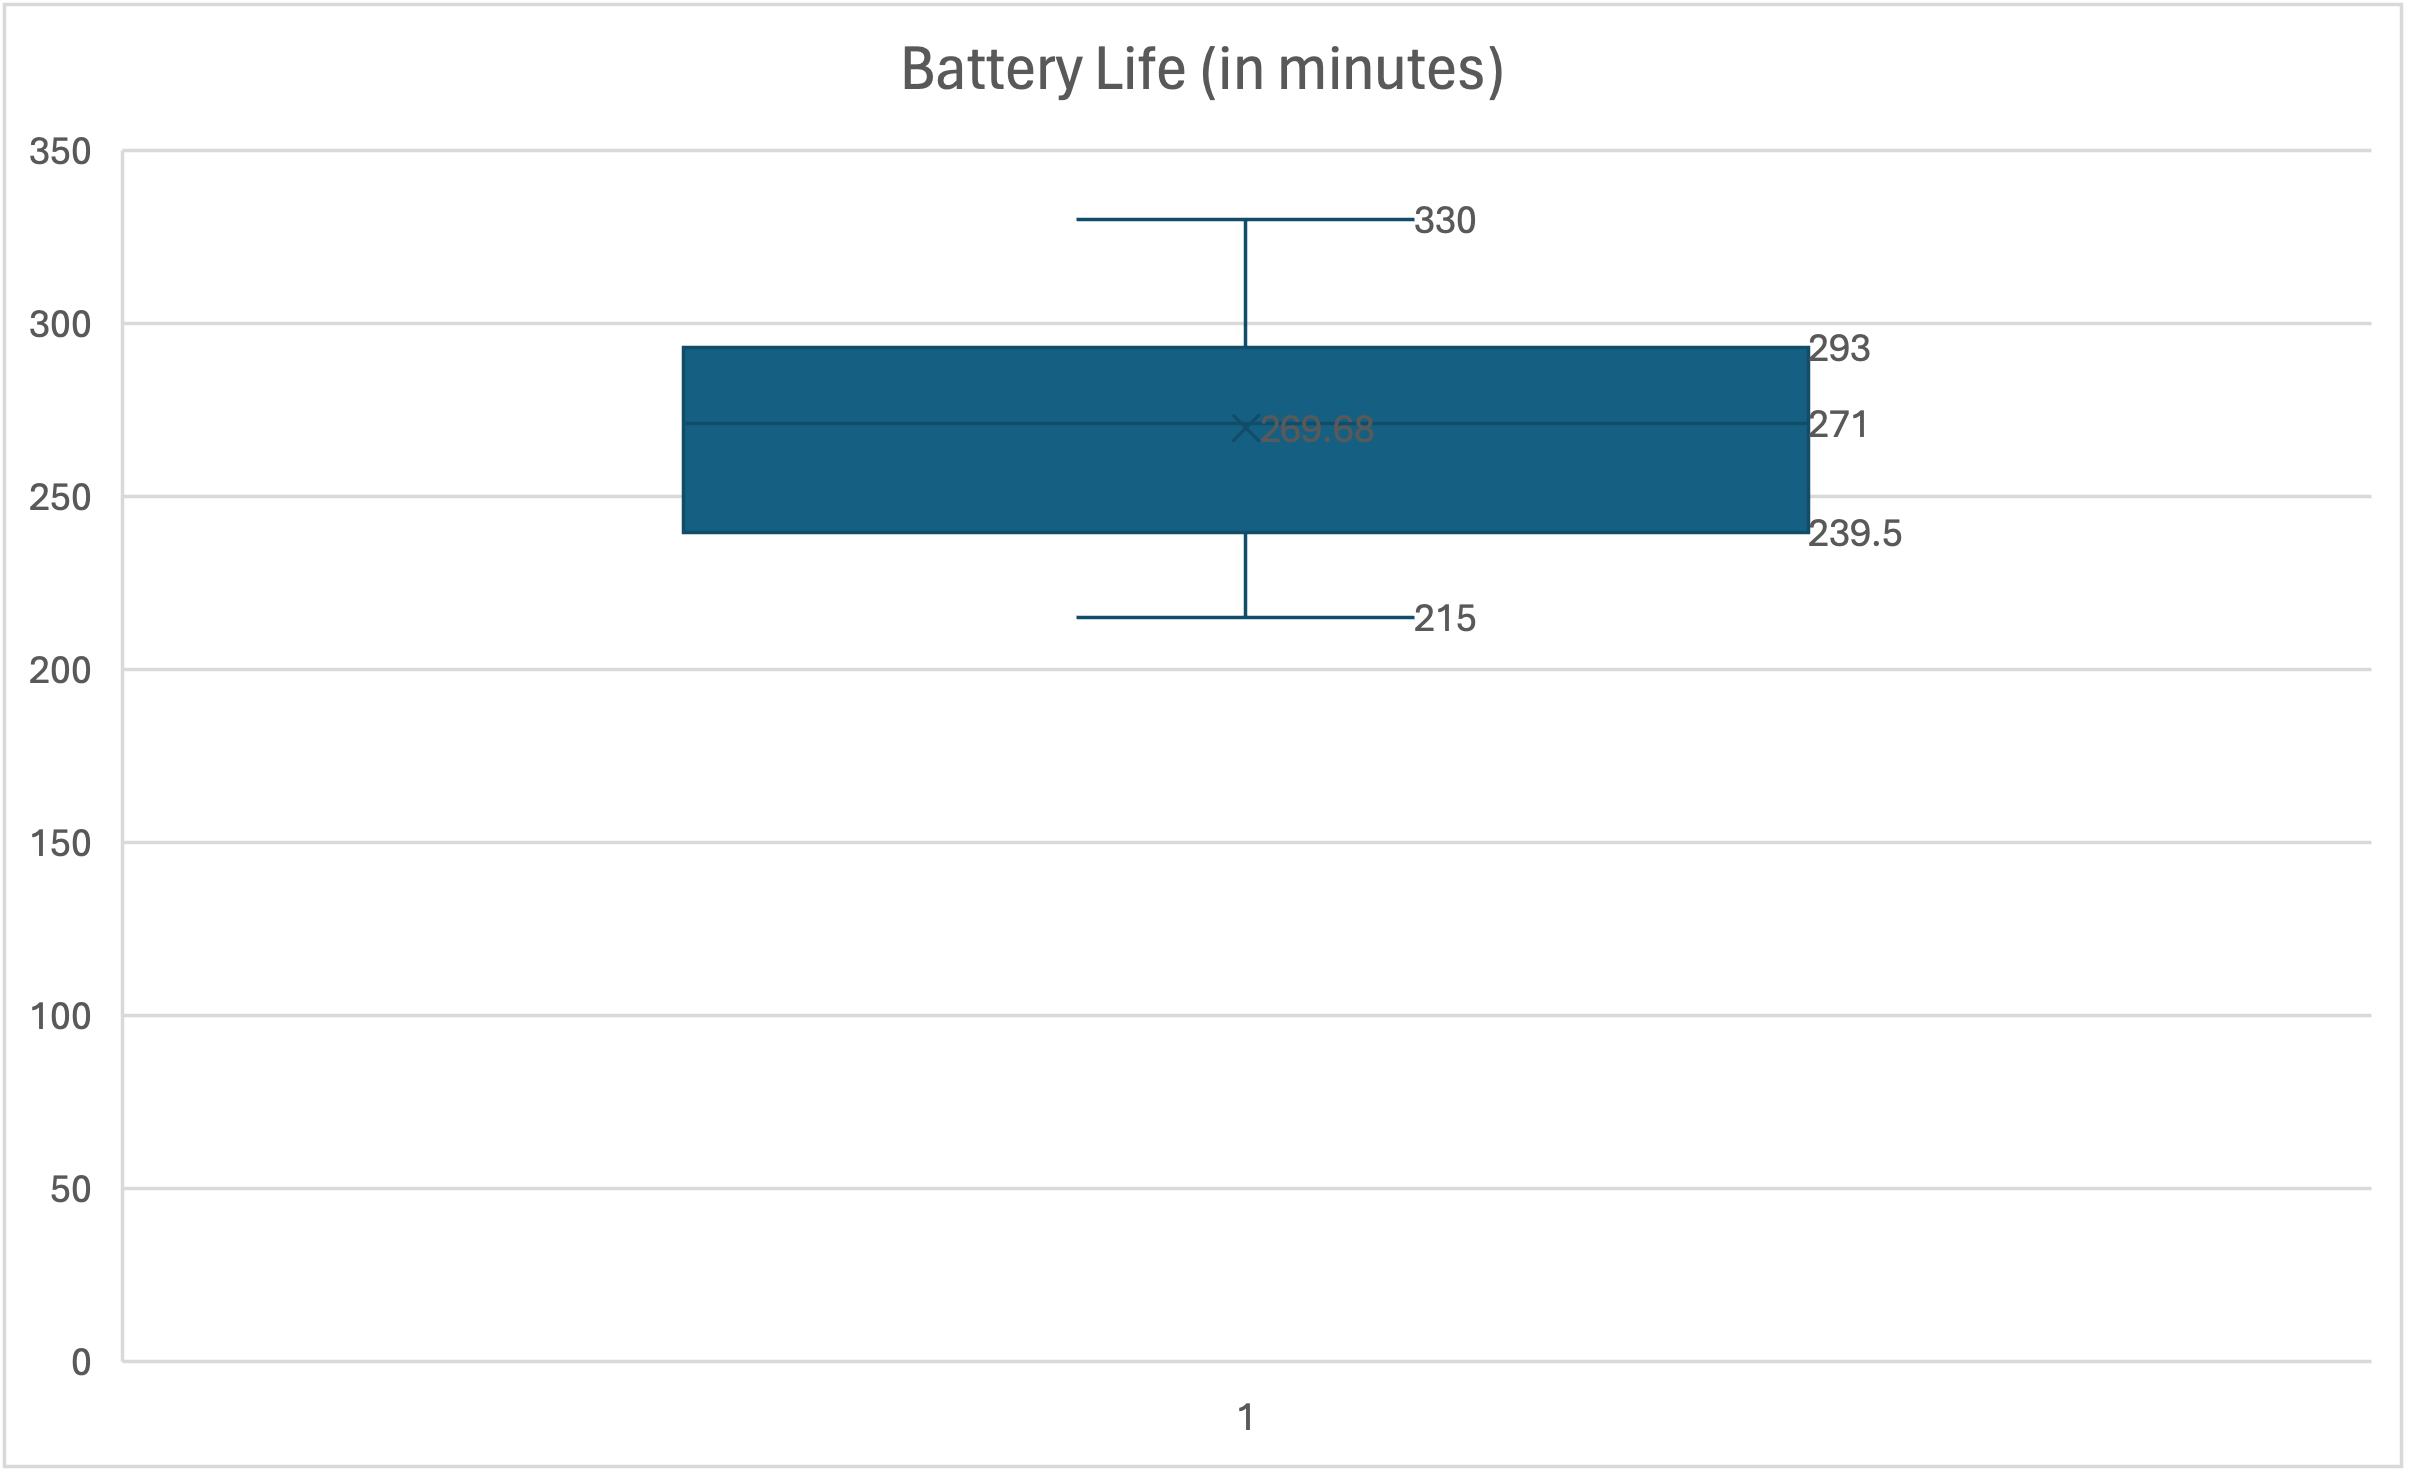
Exercise 3.4.9 .
The data in the Excel file below indicates the battery life, in minutes, on a single charge, for 25 iPads.
(a) Construct a box-and-whisker plot for the data.
(b) Compute the 5-number summary for the data.
Answer .
Minimum:
\(=MIN(A2:A26)=215\)
\(Q_1\text{:}\) \(=QUARTILE.EXC(A2:A26,1)= 239.5 \)
\(Q_2\text{:}\) \(=QUARTILE.EXC(A2:A26,2)= 271 \)
\(Q_3\text{:}\) \(=QUARTILE.EXC(A2:A26,3)= 293 \)
Maximum:
\(=MAX(A2:A26)=330\)
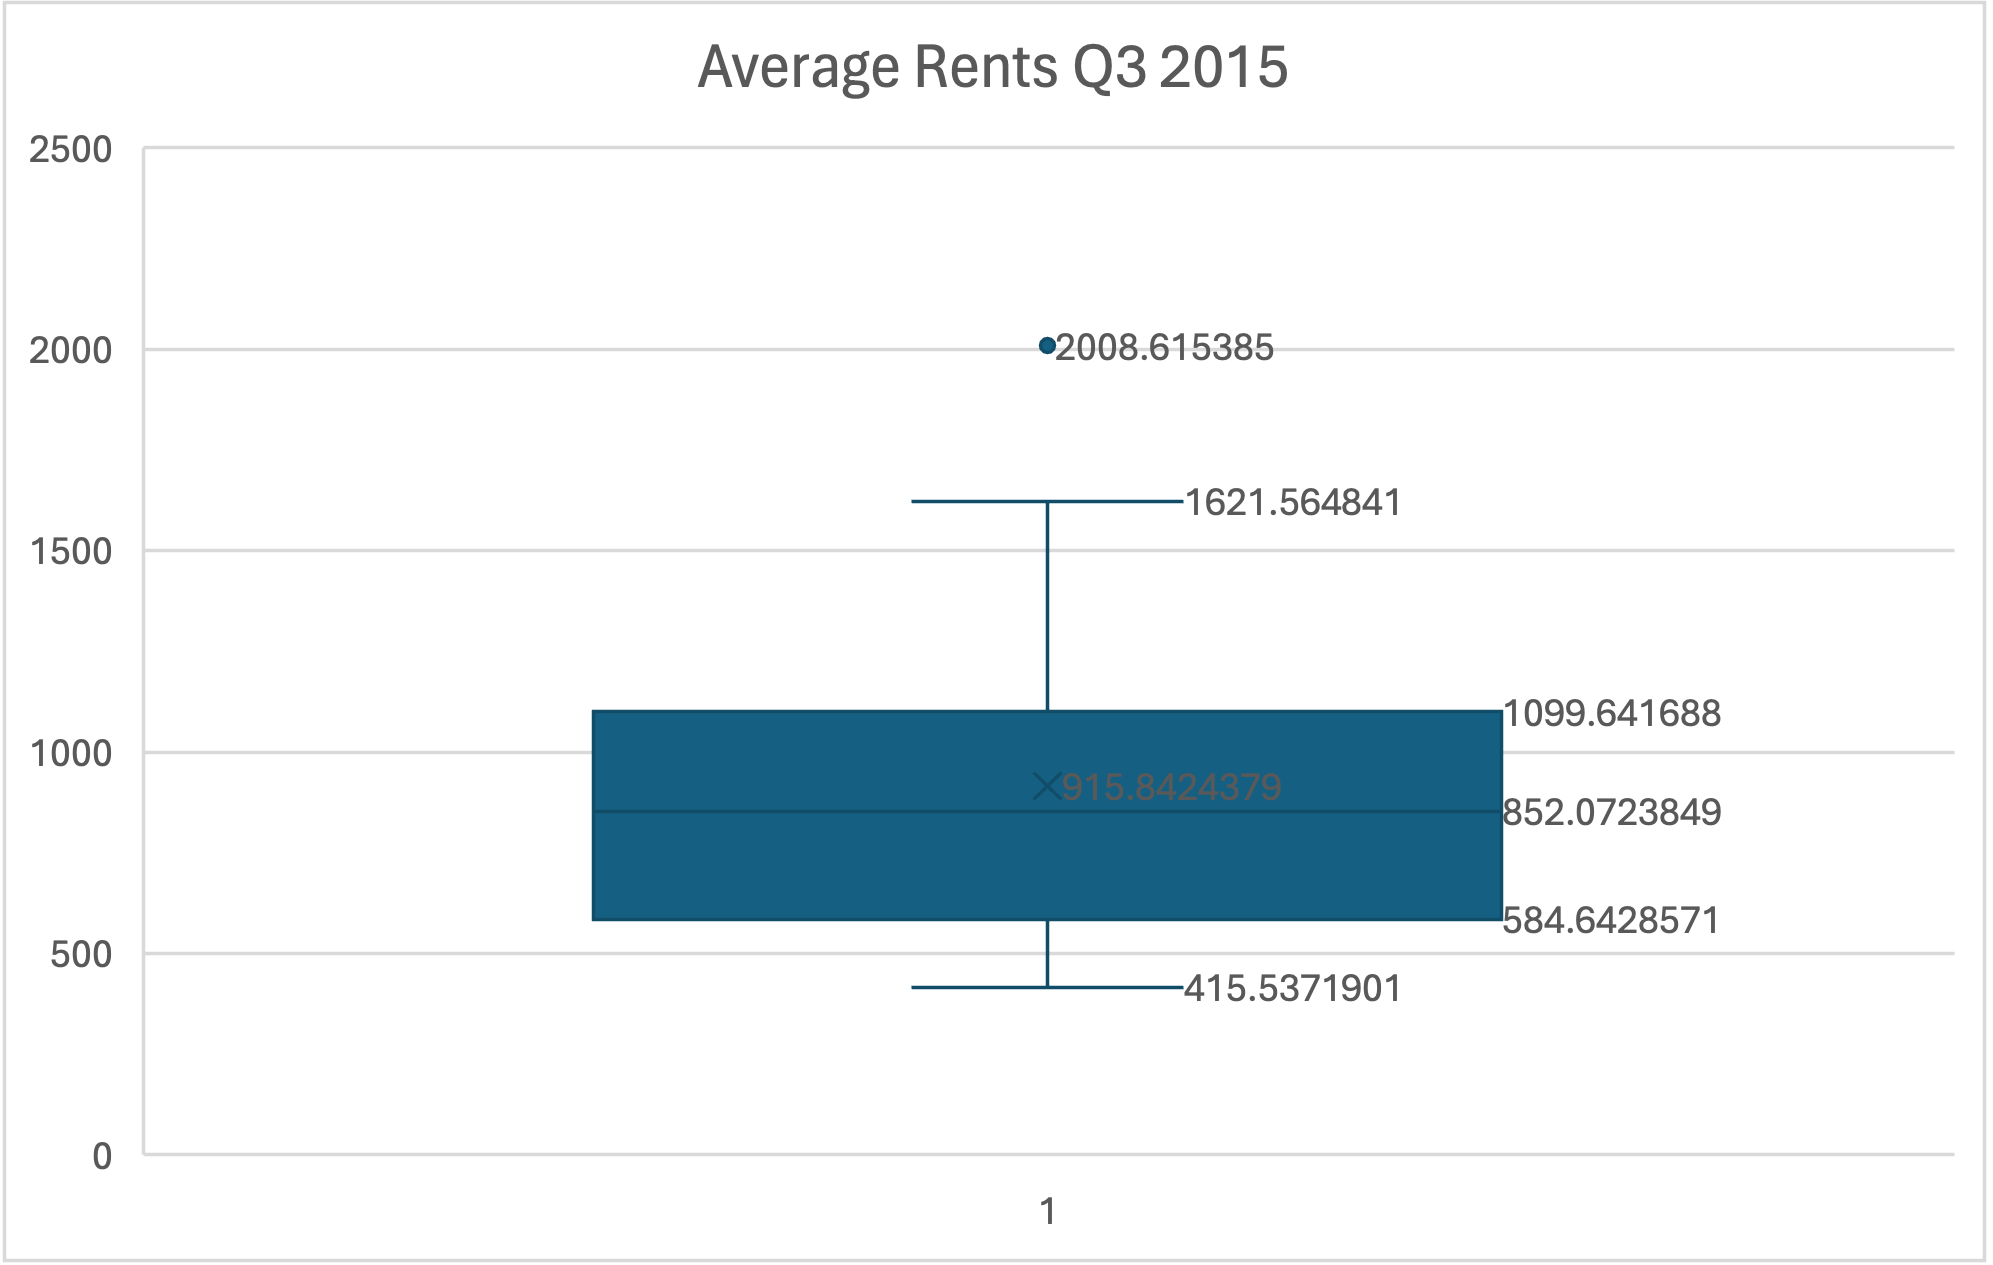
Exercise 3.4.11 .
The Excel file below includes average rent prices in a number of places in Colorado in quarter 3 of 2015. Create a box-and-whisker plot for the average rent prices and identify any outliers.
Answer .
The only outlier is the value
\(\$ 2008.62\text{,}\) which is the average rent for Boulder/Broomfield.