Investigation 5.2.1.
The 2020 United States Census found the number of households of different sizes. (Source: Table H2 from
https://www.census.gov/data/tables/2023/demo/families/cps-2023.html)
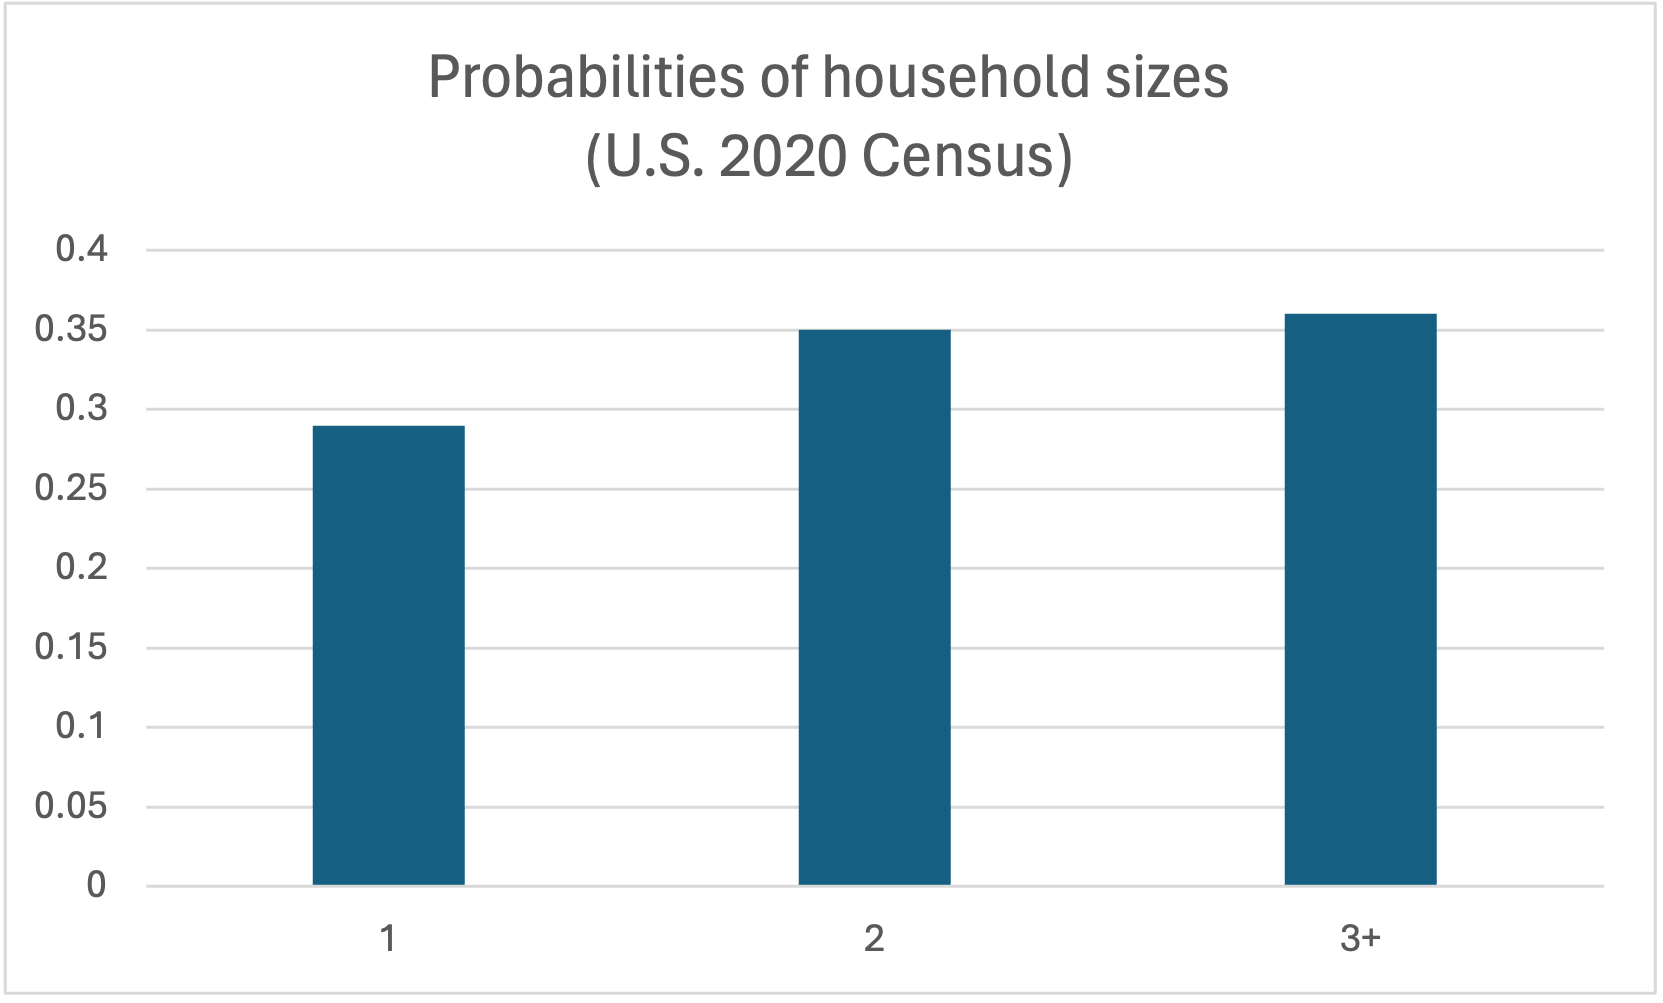
Below are the probabilities for different values of household size.
| Size | 1 member | 2 members | 3 or more members |
|---|---|---|---|
| Probability | 0.290 | 0.350 | 0.360 |
What was the average household size in the United States in 2020?
