
Section Exam 1 Information

Subsection Exam 1 Information

Exam 1 will be available on Canvas to take during class on the day listed in the syllabus. (You must be in person in the classroom to take the exam.)
  • The exam will cover Chapters 2, 3, 4, 5, 6, and 7(Part 1) from the textbook, which are Chapters 2-7 in the course notes. Link to course notes
     1 
    laurennelsen.github.io/QUAN2010/QUAN_2010_Notes.html
  • During the exam you may use your notes, the online course notes, the quiz/exam information site, a basic calculator (no phone) and a blank Excel file. Some problems will require you to upload an Excel file with all your work/calculations in order to receive credit. During quizzes you may NOT search the internet, use generative AI or use other resources that are not allowed.
  • You are NOT allowed to use other people’s work or search internet sites while taking the test. If you share you answers and others use them, both you and the students you shared with may receive a zero for the exam and may fail the course.
  • Even though you are allowed to use your notes and course resources during the exam, I strongly recommend making a “cheat sheet” to use while you take the exam! It can help you prepare for the exam and be ready for the types of questions that will be on the exam. (If you don’t prepare and practice the example problems, you might find yourself spending a long time searching and trying to figure out how to do problems while you’re taking the exam.)
  • Unless otherwise indicated, you must show steps/include all of your Excel calculations and formulas that demonstrate the process you take to get to the final answer.
    For problems involving probability distributions (such as the binomial or normal distribution), you need to use the Excel files to find any relevant values and not use values from a table.
    For problems that require showing work, credit will be given for not only the final answer, but the work/justification/formulas that supports that answer.
  • If you have a question during the exam, ask me! It is much better to ask right away than to stay stuck for a long time.

Subsection Exam 1 Format

The exam may have some or all of the following problems/types of problems. (The exam may have all of these types of problems or a subset of these types of problems. Some of these problems might not have all the parts that were on corresponding quiz/homework problems.) Examples of these problems (except for the multiple choice problems) are shown below under Exercises .
Note: On the exam, the problems may not all be labeled with the corresponding quiz objective/homework problem.
For the multiple choice problems, I recommend looking back at conceptual homework assignments, reviewing concepts from the notes/the book and making sure you understand the definitions and topics we’ve talked about.
  • Multiple choice problems from these chapters
  • Quiz objective \(\boxed{3a}\)
    Link to example solutions for 3a
     2 
    laurennelsen.github.io/QUAN2010QuizExamExamples/sec-quiz-3.html
  • Quiz outcomes \(\boxed{4a}\) and \(\boxed{4b}\)
    Link to Quiz 4 example solutions
     3 
    laurennelsen.github.io/QUAN2010QuizExamExamples/sec-quiz-4.html
  • Quiz objectives \(\boxed{1b}\) and \(\boxed{1c}\)
    Link to example solutions for 1b and 1c
     4 
    laurennelsen.github.io/QUAN2010QuizExamExamples/sec-quiz-1.html
  • Quiz objective \(\boxed{2a}\) (This problem will require uploading an Excel file with all your work/formulas.)
    Link to example solutions for 2a
     5 
    laurennelsen.github.io/QUAN2010QuizExamExamples/sec-quiz-2.html
  • Quiz objective \(\boxed{3b}\) (This problem will require uploading an Excel file with all your work/formulas.)
    Link to example solutions for 3b
     6 
    laurennelsen.github.io/QUAN2010QuizExamExamples/sec-quiz-3.html
  • Box-and-whisker plot: You will be given a dataset and asked to construct a box-and-whisker plot for the data. You will need to list the values of the first three quartiles: Q1, Q2, and Q3 and identify any outliers in the data. You will need to do all of your work in Excel and upload the file to Canvas. This is similar to parts of quiz objective \(\boxed{2b}\) .
  • Problem using the Empirical Rule
  • Problem identifying mistake in a solution using Chebyshev’s Theorem.
    (We did a problem using Chebyshev’s Theorem in Exercise 3.3.11(d) in the Course Notes, and it might help to look back at that https://laurennelsen.github.io/QUAN2010/sec-mean-and-stdev.html.)
  • Quiz outcome \(\boxed{4c}\)
    Link to Quiz 4 example solutions
     7 
    laurennelsen.github.io/QUAN2010QuizExamExamples/sec-quiz-4.html

Subsection Suggestions for Study

Look over all of your class notes and make sure you understand everything we have talked about. Look back at these chapters/problems in the textbook. Review the MyLab homework and the quiz problems. (I do not guarantee that all exam questions will look exactly like one of those problems.)
Be able to do the problems under Exercises , and potentially include those on your “cheat sheet”.

Exercises Exercises

1.

    Quiz outcome \(\boxed{1b}\text{:}\)
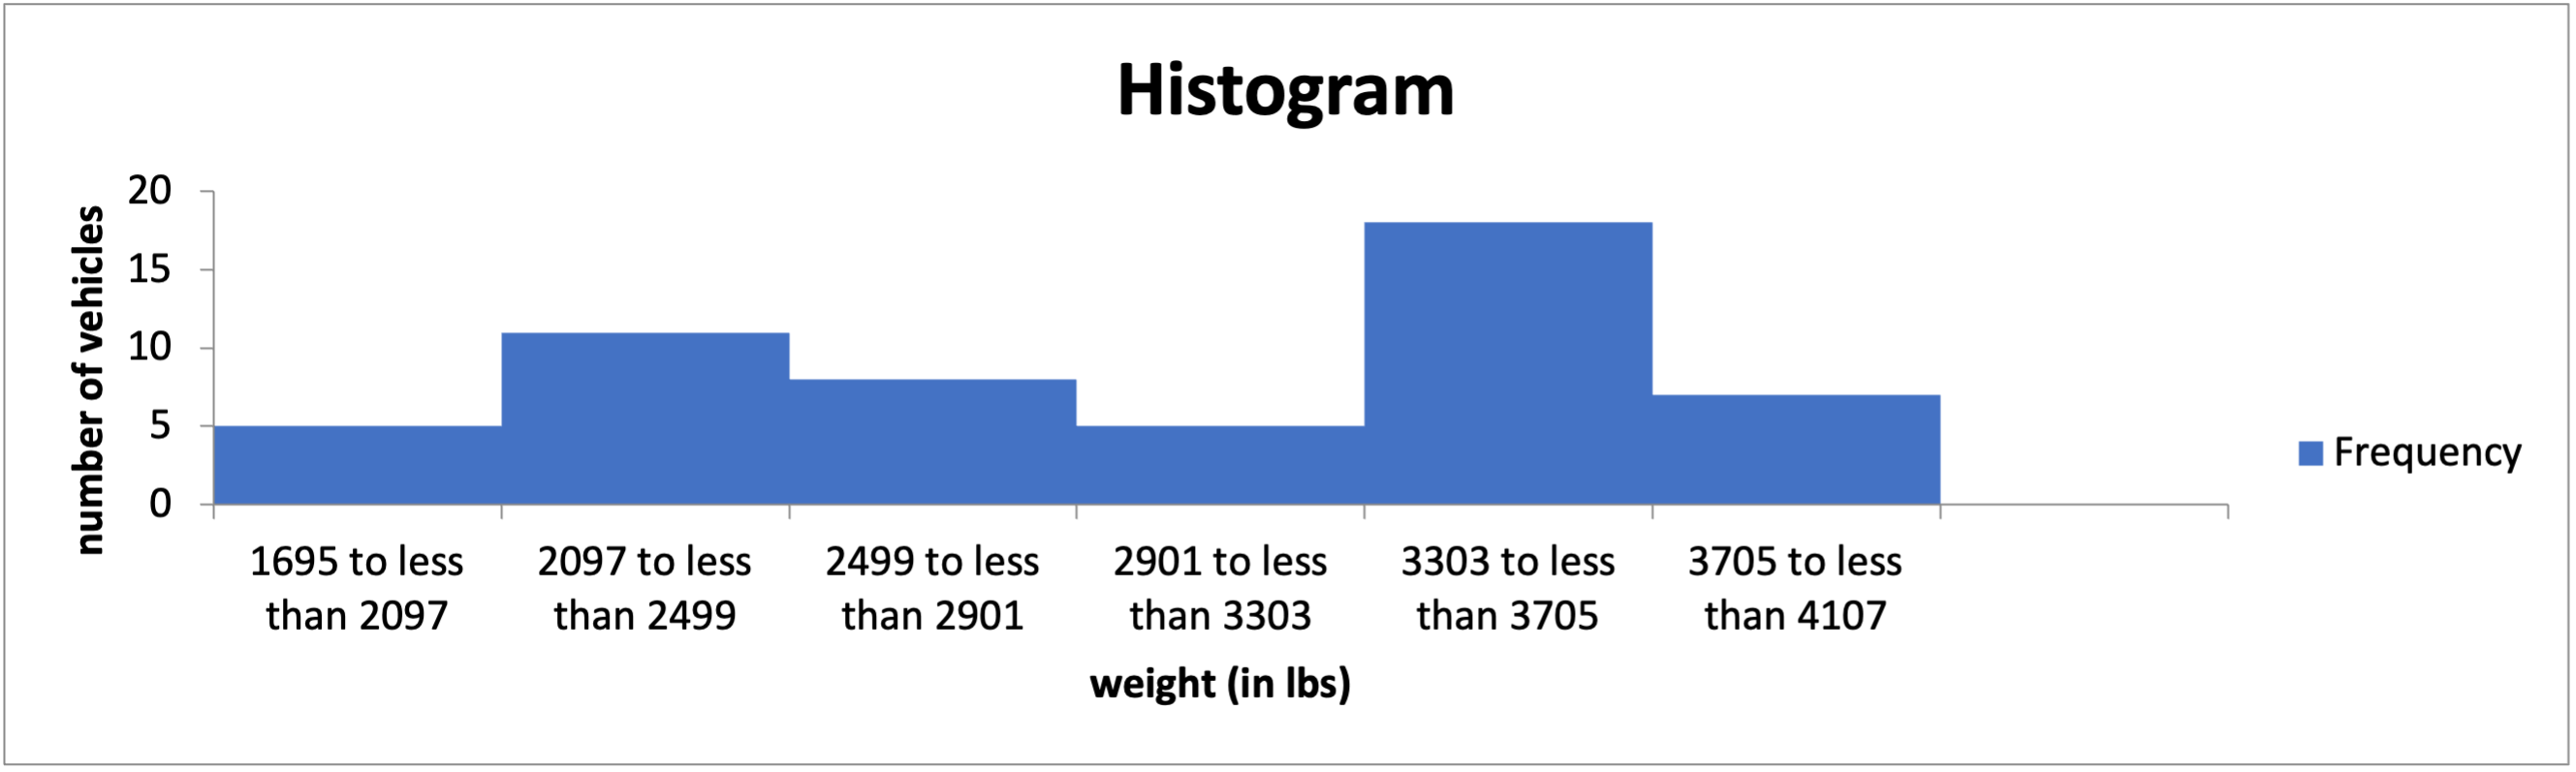
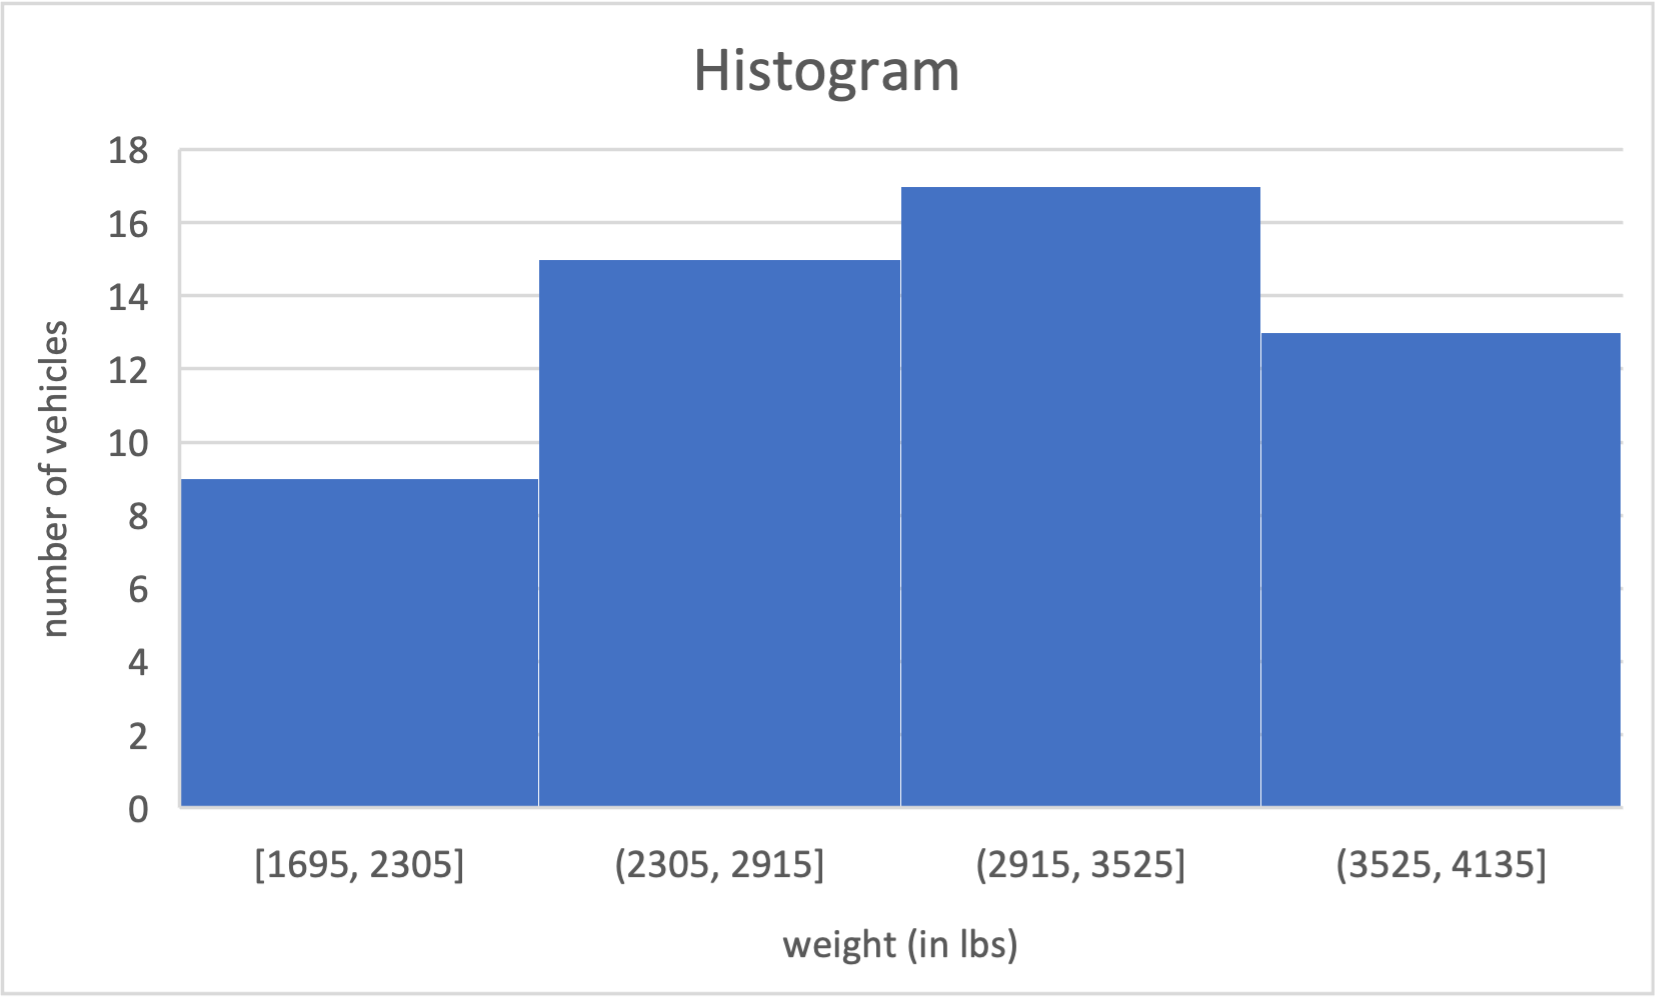
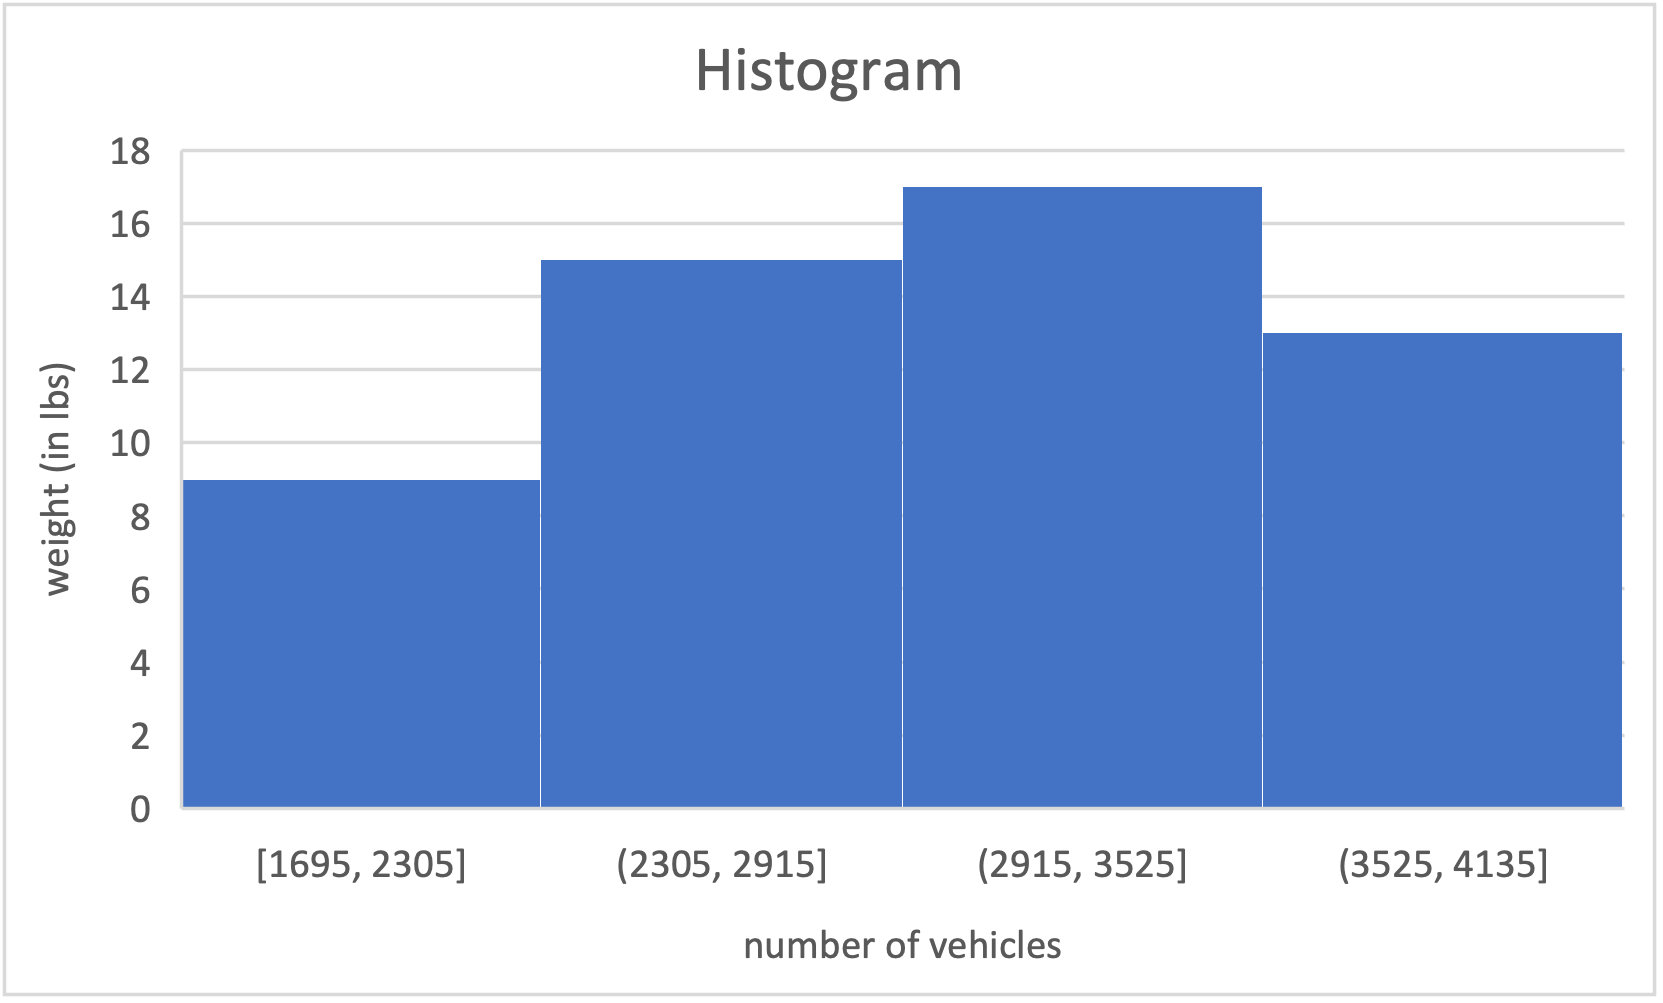
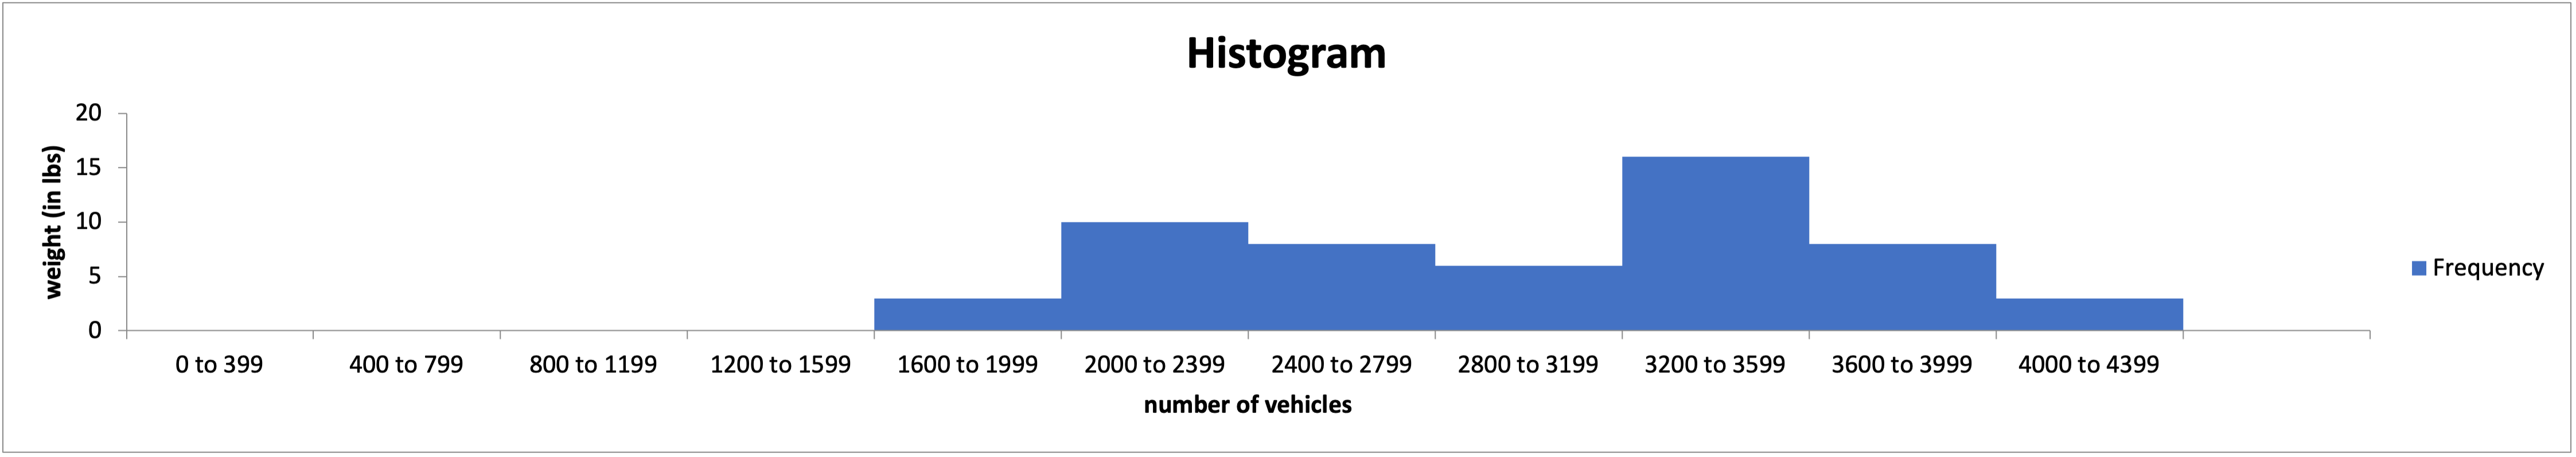
    We want to create a histogram using the Data Analysis add-in in Excel. If we use the \(2^k\geq n\) Rule to find the number of bins, which of the following would be a histogram for “weight (in lbs)” in the Excel file below?

2.

Quiz outcome \(\boxed{1c}\text{:}\)
The Excel file below includes data about cars released in 1993. Use the Excel file to create a bar chart for “drive_train”.
The different options for drive train are below:
  • front
  • rear
  • 4WD
(On the exam you will do all of your work in the attached file and then save and upload it on Canvas.)
Hint.
(One way to do this is to first create a frequency distribution using the "COUNTIF" function and use that to create your bar chart.)
Answer.

3.

Quiz objective \(\boxed{2a}\text{:}\)
Consider the data included in the Excel file below:
(a)
Find the mean of this data set. (Round your answer to two decimal places.)
Answer.
\(\approx 39.33\)
(b)
Find the median of this data set.
Answer.
\(39\)
(c)
Find the mode of this data set. (Enter "none" of there is no mode and if there are multiple modes, then enter them in increasing order separated by commas and no spaces.)
Answer.
none
(d)
Identify whether or not there may be left or right skew in this data set. (Enter "left", "right", or "none".)
Answer.
Either “right” or “none” would be correct answers here. (Technically the mean is to the right of the median, but they are very close together.)

4.

Quiz objective \(\boxed{3a}\text{:}\)
(This problem will be multiple choice for each part -- you’ll need to choose which of several fractions is the correct probability.)
The airline industry defines an on-time flight as one that arrives within 15 minutes of its scheduled time. The following table shows the number of on-time and late flights leaving Philadelphia and arriving in Orlando during a recent time period by airline:
Airline On-Time Flights Late Flights
Southwest 240 70
American 260 140
Frontier 170 65
(a)
What is the probability that a randomly selected flight was from American and was on time?
Answer.
Airline On-Time Flights Late Flights Totals:
Totals: 670 275 945
Southwest 240 70 310
American 260 140 400
Frontier 170 65 235
\(\frac{260}{945}\approx 0.2751\)
(b)
What is the probability that a randomly selected flight was from Southwest or was on time?
Answer.
\(\frac{310+670-240}{945}\approx 0.7831\)
(c)
Given that the flight was late, what is the probability that it was from Frontier?
Answer.
\(\frac{65}{275}\approx 0.2364\)
(d)
Given that the flight was from Frontier, what is the probability that it was late?
Answer.
\(\frac{65}{235}\approx 0.2766\)

5.

Quiz objective \(\boxed{3b}\text{:}\)
(For this problem, round each answer to 4 decimal places. Do not round until you have the final answer.)
Consider store that sells primarily PCs. Each customer that comes in may buy one, none or several PCs. Let \(X\) denote the number of PCs a customer who comes into the store purchases. Consider the following probability distribution table for \(X\text{:}\)
\(X_i\) \(0\) \(1\) \(2\) \(3\)
\(P(X=X_i)\) ??? \(0.374\) \(0.09\) \(0.02\)
  1. What is the value of the missing entry?
  2. Find the expected value of \(X\text{,}\) \(E(X)\text{.}\)
  3. Find the variance of \(X\text{,}\) \(Var(X)\text{.}\)
  4. Find the standard deviation of \(X\text{,}\) \(\sigma_X\text{.}\)
Answer.

6.

Box-and-whisker plot
The data in the attached file below shows the amount spent on lunch by a random sample of customers at a local restaurant.
Construct a box-and-whisker plot for the data. List the values of the first three quartiles: Q1, Q2, and Q3. Are there any outliers in the data? If so, identify them.
(On the exam you will do all of your work in the attached file and then upload your file on Canvas.)
(Note: your quartile values should be the same as the values of the quartiles shown in your box-and-whisker plot.)

7.

Problem using the Empirical Rule
The average employees’ annual healthcare costs at a particular company for 2024 was \(\$13,000\) with a standard deviation of \(\$4,750\text{.}\) If the distribution of those healthcare costs is approximately bell-shaped, between what two values would 95% of employees’ share of annual healthcare costs fall? (Hint: Use the Empirical Rule.)
Include all of your calculations in the Excel file that you upload.

8.

Problem identifying mistake in a solution using Chebyshev’s Theorem:
Assume the average selling price for houses in a certain county is \(\$ 348,000\) with a standard deviation of \(\$ 30,000\text{.}\) Assume that the distribution of home selling prices is not bell-shaped.
We want to find a range of prices that we expect to include at least \(91\%\) of the homes around the mean. A student wanted to solve this problem and did the work below. Identify the issue or mistake with this work/solution.
Student’s solution:
\begin{equation*} 1-\frac{1}{z^2}=0.91 \end{equation*}
\begin{equation*} 1-0.91=\frac{1}{z^2} \end{equation*}
\begin{equation*} 0.09 = \frac{1}{z^2} \end{equation*}
\begin{equation*} 0.09z^2 = 1 \end{equation*}
\begin{equation*} z^2=\frac{1}{0.09} \end{equation*}
\begin{equation*} z=\sqrt{\frac{1}{0.09}} \end{equation*}
So the range of prices including values within \(\sqrt{\frac{1}{0.09}}\) of the mean will include at least \(91\%\) of the homes.
\begin{equation*} \mu\pm \sqrt{\frac{1}{0.09}}\sigma \end{equation*}
\begin{equation*} 348,000\pm \sqrt{\frac{1}{0.09}}\cdot 30,000 \end{equation*}
\begin{equation*} \boxed{\$248,000\text{ to }\$ 448,000} \end{equation*}
Answer.
This solution is correct and does not have a mistake. On the exam, you might have a version that is not correct and you will need to determine what the mistake is. (This problem will be multiple choice.)

9.

Quiz Objective \(\boxed{4a}\text{:}\)
Your class conducted a survey last week on whether students prefer digital or paper textbooks. Out of 120 responses, 72 preferred digital.
You are designing a promotional campaign for a new digital textbook. You plan to randomly sample 10 students from the same population.
(a)
Is it appropriate to model the number of students who prefer digital textbooks using a binomial distribution? Justify your answer.
Options:
  • Yes because more than half of students in the previous survey preferred digital
  • Yes because we are asking a fixed number of people, the only options for each student are that they do prefer digital textbooks or they do not prefer digital textbooks, the probability is the same each time, and what one student prefers should be independent of what another prefers
  • No because we are asking a fixed number of people, the only options for each student are that they do prefer digital textbooks or they do not prefer digital textbooks, the probability is the same each time, and what one student prefers should be independent of what another prefers
  • Yes because we are asking a fixed number of people, the only options for each student are that they do prefer digital textbooks or they do not prefer digital textbooks, the probability changes each time, and what one student prefers should be independent of what another prefers
  • No because more than half of students in the previous survey preferred digital
Answer.
Yes because we are asking a fixed number of people, the only options for each student are that they do prefer digital textbooks or they do not prefer digital textbooks, the probability is the same each time, and what one student prefers should be independent of what another prefers
(b)
Assuming it is appropriate, what formula would you use to find the probability that at least 8 of the 10 sampled students prefer digital?
Options:
  • 1-BINOM.DIST(7,10,72/120,0)
  • 1-BINOM.DIST(8,10,72/120,1)
  • 1-BINOM.DIST(7,10,72/120,1)
  • BINOM.DIST(7,10,72/120,1)
  • BINOM.DIST(8,10,72/120,1)
  • BINOM.DIST(8,10,72/120,0)
  • 1-BINOM.DIST(8,10,72/120,0)
  • 1-NORM.DIST(8,10,72/120,1)
  • NORM.DIST(8,10,72/120,1)
Answer.
1-BINOM.DIST(7,10,72/120,1)

10.

Quiz Objective \(\boxed{4b}\text{:}\)
Let \(Z\) be the standard normal variable.
(a)
Consider the Excel formula given below:
\begin{equation*} =1-NORM.S.DIST(1.06,1) \end{equation*}
Which of the following probabilities could this formula be used to calculate?
Options:
  • the probability that Z is bigger than 1.06
  • the probability that Z is less than 1.06
  • the probability that Z is equal to 1.06
  • the probability that Z is between 1 and 1.06
Answer.
the probability that Z is bigger than 1.06
(b)
Consider the Excel formula given below:
\begin{equation*} =NORM.S.DIST(3.2,1)-NORM.S.DIST(-1.7,1) \end{equation*}
Which of the following probabilities could this formula be used to calculate?
Options:
  • the probability that Z is between -1.7 and 3.2
  • the probability that Z is bigger than 3.2 or smaller than -1.7
  • the probability that Z is bigger than 3.2 and -1.7
  • the probability that Z is between 1 and 3.2 or between 1 and -1.7
Answer.
the probability that Z is between -1.7 and 3.2
(c)
Which of these formulas could be used to find \(z^{\star}\) such that \(P(Z\leq z^{\star})=0.96\text{?}\)
Options:
  • =NORM.S.INV(0.04)
  • =NORM.S.INV(0.96)
  • =NORM.S.DIST(0.96)
  • =NORM.S.DIST(0.04)
  • =1-NORM.S.INV(0.96)
  • =1-NORM.S.INV(0.04)
  • =1-NORM.S.DIST(0.96)
  • =1-NORM.S.DIST(0.04)
Answer.
=NORM.S.INV(0.96)
(d)
Which of these formulas could be used to find \(z^{\star}\) such that \(P(-z^{\star}\leq Z\leq z^{\star})=0.95\text{?}\)
Options:
  • NORM.S.INV(0.95+0.05)
  • NORM.S.INV(0.95 + 0.05/2)
  • NORM.S.INV(0.95)
  • NORM.S.INV(1-0.95/2)
  • 1-NORM.S.INV(0.95)
  • 1-NORM.S.INV(0.975)
  • NORM.S.DIST(0.95+0.05/2)
  • NORM.S.DIST(0.95)
  • NORM.S.DIST(0.95+0.05)
Answer.
NORM.S.INV(0.95 + 0.05/2)

11.

Quiz Objective \(\boxed{4c}\text{:}\)
A random variable follows a normal probability distribution with a standard deviation of 5.
(a)
What formula would you use to find the probability shown below?
Options:
  • NORM.DIST(32,38,5,1)
  • 1-NORM.DIST(32,38,5,1)
  • NORM.DIST(32,5,38,1)
  • 1-NORM.DIST(32,5,38,1)
  • NORM.DIST(32,38,5,0)
  • 1-NORM.DIST(32,38,5,0)
  • NORM.S.DIST(32,1)
  • 1-NORM.S.DIST(32,1)
Answer.
NORM.DIST(32,38,5,1)
(b)
What formula would you use to find the probability shown below?
Options:
  • NORM.DIST(40,38,5,1)
  • 1-NORM.DIST(40,38,5,1)
  • NORM.DIST(40,5,38,1)
  • 1-NORM.DIST(40,5,38,1)
  • NORM.DIST(40,38,5,0)
  • 1-NORM.DIST(40,38,5,0)
  • NORM.S.DIST(40,1)
  • 1-NORM.S.DIST(40,1)
Answer.
1-NORM.DIST(40,38,5,1)
(c)
What formula would you use to find the probability shown below?
Options:
  • NORM.DIST(35,38,5,1)-NORM.DIST(40,38,5,1)
  • NORM.DIST(40,38,5,1)-NORM.DIST(35,38,5,1)
  • NORM.DIST(40,5,38,1)-NORM.DIST(35,5,38,1)
  • NORM.DIST(35,5,38,1)-NORM.DIST(40,5,38,1)
  • NORM.DIST(40,38,5,0)-NORM.DIST(35,38,5,0)
  • NORM.DIST(35,38,5,0)-NORM.DIST(40,38,5,0)
  • NORM.S.DIST(40,1)-NORM.S.DIST(35,1)
Answer.
NORM.DIST(40,38,5,1)-NORM.DIST(35,38,5,1)