Section Exercises

Example 5.1. California Power & Light Company.

The California Power & Light Company (CP&L) is starting a project designed to increase the generating capacity of one of its plants in Southern California.
An analysis of similar construction projects indicated that the possible completion times for the project are 8, 9, 10, 11, and 12 months.
  • Let \(C\) denote the event that the project is completed in 10 months or less:
    \begin{equation*} C=\{8,9,10\} \end{equation*}
  • Let \(L\) be the event that the project is completed in less than 10 months:
    \begin{equation*} L=\{8,9\} \end{equation*}
  • Let \(M\) be the event that the project is completed in more than 10 months:
    \begin{equation*} M=\{11,12\} \end{equation*}
The table below gives the past completion times for 40 CP&L projects.
Completion Time (months) No. of Past Projects Having This Completion Time Probability of Outcome
8 6
9 10
10 12
11 6
12 6
Total

(a)

Calculate the probability of the different outcomes.

(b)

Calculate the probabilities of the events on the previous slide:
  • \(\displaystyle C=\{8,9,10\}\)
  • \(\displaystyle L = \{8,9\}\)
  • \(\displaystyle M = \{11,12\}\)
(Feel free to do these in Excel!)
Example 5.2. Employee Dissatisfaction.

The HR manager of a software company conducted a study and found the following:
  • \(30\%\) of the employees who left the firm within two years listed dissatisfaction with their salary as one of the reasons
  • \(20\%\) listed dissatisfaction with their work assignments as one of the reasons
  • \(12\%\) listed dissatisfaction with both their salary and their work assignments.
What is the probability that an employee who leaves within two years does so because of dissatisfaction with salary, dissatisfaction with the work assignment, or both?
Let
  • \(S=\) the event that the employee leaves because of salary
  • \(W=\) the event that the employee leaves because of work assignment

Example 5.3. Mortgage Default Data.

Open the “mortgagedefaultdata” file in Excel. external/sheets/mortgagedefaultdata.xlsx
This data is from a bank that is interested in the mortgage default risk for its home mortgage customers. Some of these customers have defaulted on their mortgages and others have continued to make on-time payments.
The data includes the age of the customer at the time of the mortgage origination, the marital status of the customer, the annual income of the customer, the mortgage amount, the number of payments made by the customer per year on the mortgage, the total amount paid by the customer over the lifetime of the mortgage, and whether or not the customer defaulted on the mortgage.
Create a PivotTable for the marital status and whether the customer defaults on their mortgage.

Example 5.4. Mortgage Default Data Continued.

Open the “mortgagedefaultdata” file again in Excel. external/sheets/mortgagedefaultdata.xlsx
Using the PivotTable you made in Example 5.3, calculate the following probabilities:
  • the probability a customer is single and defaults
  • the probability a customer is married and does not default
  • the probability a customer who is married will default
  • the probability a customer is single if you know they do not default

Example 5.5. Mortgage Default Data Conditional Probability.

If we look back at Example 5.4, we can see that
\begin{equation*} P(M) = 0.4766 \text{ and } P(D|M) = 0.5524. \end{equation*}
Using this information, what is the probability that a customer defaults on their mortgage and is married?

Example 5.6. Manufacturing Parts Quality.

Consider a manufacturing firm that receives shipments of parts from two different suppliers.
  • \(A_1\text{:}\) the event that a part is from supplier 1
  • \(A_2\text{:}\) the event that a part is from supplier 2
Currently \(65\%\) of the parts purchased by the company are from supplier 1 and the remaining \(35\%\) are from supplier 2.
The quality of the parts varies according to their source.
  • \(G\text{:}\) the event that a part is good
  • \(B\text{:}\) the event that a part is bad
Historical data suggests the following:
  • \(\displaystyle P(G|A_1) = 0.98 ~~~~~~~~~ P(B|A_1)=0.02\)
  • \(\displaystyle P(G|A_2) = 0.95 ~~~~~~~~~ P(B|A_2) = 0.05\)
Find \(P(A_1,G) = P(A_1\cap G)\text{.}\)

Example 5.7. Manufacturing Parts Quality (Continued).

Now suppose that the parts from the two suppliers in Example 5.6 are used in the firm’s manufacturing process and that a machine breaks down while attempting the process using a bad part. Given the information that the part is bad, what is the probability that it came from supplier 1 and what is the probability that it came from supplier 2?
Hint.
(Find \(P(A_1|B)\) and \(P(A_2|B)\text{.}\))

Example 5.8. Mortgage Payments.

Let’s consider a mortgage provider that has information on customers who default on their mortgages. Customers can make monthly payments, two payments per month, or quarterly payments.
Consider the random variable describing the number of payments made per year by the customers.
Find the probability distribution/“probability mass function”, \(f(x)\text{:}\)
Number of payments per year Number of observations \(f(x)\)
\(x=4\) 45
\(x=12\) 180
\(x=24\) 75

Example 5.9. Mortgage Payments (Continued).

Let’s go back to the mortgage example from Example 5.8. What is the expected value of the number of payments made by a mortgage customer in a year?

Example 5.10. Mortgage Payments (Continued).

Let’s go back to the mortgage example from Example 5.8. Calculate the variance and the standard deviation of the number of payments per year.

Example 5.11. Plant Expansion Project.

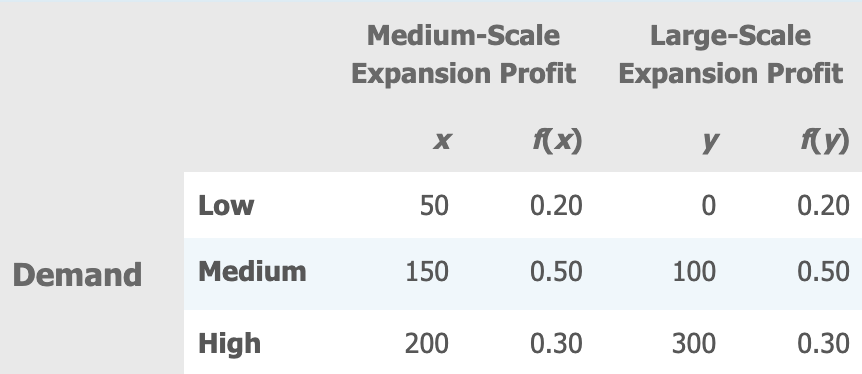
A computer company is considering a plant expansion to enable the company to begin production of a new computer product. The company’s president must determine whether to make the expansion a medium- or large-scale project. Demand for the new product is uncertain, which for planning purposes may be low demand, medium demand, or high demand. The probability estimates for demand are 0.2, 0.5, and 0.3, respectively. Letting \(x\) and \(y\) indicate the annual profit in thousands of dollars, the firm’s planners developed the following profit forecasts for the medium- and large-scale expansion projects:

(a)

Compute the expected value for the profit associated with the two expansion alternatives. Which decision is preferred for the objective of maximizing the expected profit?
Answer.
Medium is preferred

(b)

Compute the variance for the profit associated with the two expansion alternatives. Which decision is preferred for the objective of minimizing the risk or uncertainty?
Answer.
Medium is preferred due to less variance

Example 5.12. Basketball Free Throw Probability.

Consider a basketball player whose probability of making a free throw is 0.7. If they shoot 5 free throws, what is the probability they make exactly 3 of them?