
Section Exercises

Example 3.1. Restaurant Reviews.

The data file “Restaurant” contains data from Zagat’s Restaurant Review. Data on the quality rating, meal price, and the usual wait time for a table during peak hours were collected for a sample of 300 Los Angeles area restaurants.
What if we want to know the number of restaurants in each combination of Quality and Price?
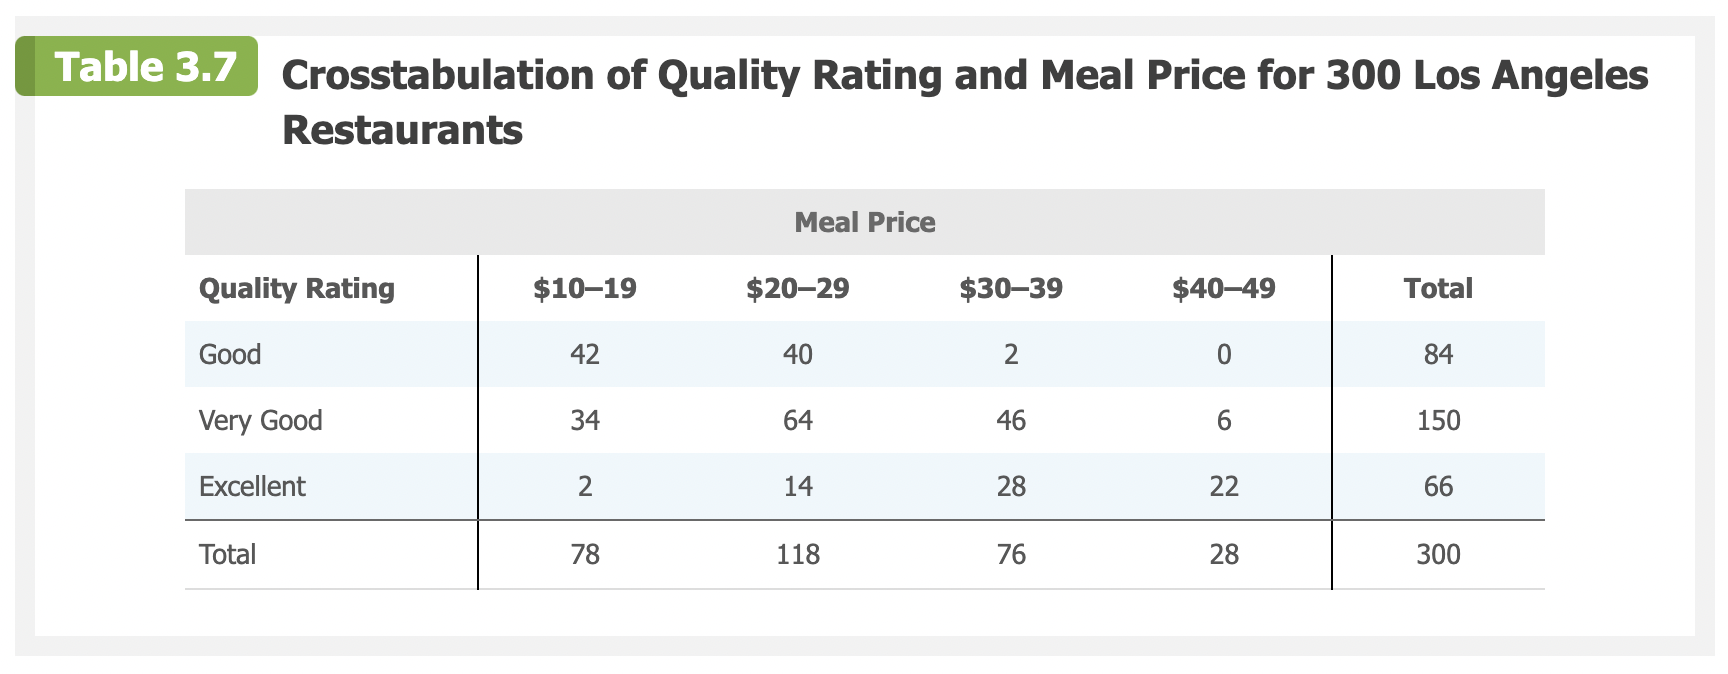
  • We could manually count how many restaurants are rated Good with mean prices between \(\$ 10\) and \(\$ 19\) for example, and so on, and create a table like Table 3.7 in the book:
  • Let’s use PivotTables instead of doing it manually!

Example 3.2. Ajax.

Open the file “Ajax”. We’re going to make a scatter plot using some of this data. Let’s think about how we can improve on the default chart that Excel displays so that the data stands out.

Example 3.3. Kirkland Regional Sales.

Open the file “KirklandRegional” that shows regional sales data by month for air compressors at Kirkland Industries. We’re going to investigate some of the charts we can make with this data. (These steps are in the textbook if you want to follow along.)

Example 3.4. Accounts Managed.

Example 3.5. Auto Production.

Open the file “AutoProduction”. Let’s see how we can create bad pie charts and 3-D charts in Excel (and why they are not helpful ways to visualize the data).

Example 3.6. Billionaires Bubble Chart.

Example 3.7. Heat Map in Excel.

Example 3.8. Parallel Coordinates Plot.

Let’s look at an example of what is called a ``parallel coordinates" plot. (There might be a homework problem about this type of plot.)
This example uses something called Python to create the visualization.

Example 3.9. Restaurants PivotChart.

Open the “Restaurant” file again. We’ll work through how to create a PivotChart together. (If we don’t have time for this in class, then work through this on your own following the steps in the textbook!) external/sheets/Restaurant.xlsx

Example 3.10. Tableau Visualizations.

We’re going to see how to create several visualizations in Tableau using the files listed below: